Detection of Myocardial Damages in Hypertrophic Cardiomyopathy Using Non-Contrast T1 Mapping
* Yoshiaki Morita;
Naoaki Yamada;
Teruo Noguchi;
Tetsuya Fukuda;
-
* Yoshiaki Morita: Department of Radiology, Tohoku University Hospital, Sendai, Japan; Department of Radiology, National Cerebral and Cardiovascular Center, Suita, Osaka, Japan.
-
Naoaki Yamada: Department of Radiology, National Cerebral and Cardiovascular Center, Suita, Osaka, Japan.
-
Teruo Noguchi: Department of Cardiology, National Cerebral and Cardiovascular Center, Suita, Osaka, Japan.
-
Tetsuya Fukuda: Department of Radiology, National Cerebral and Cardiovascular Center, Suita, Osaka, Japan.
Abstract
Purpose: Late Gadolinium Enhancement (LGE) is widely used method to evaluate the myocardial damages, such as fibrosis. However, the patients with renal insufficiency, asthma and so on have a higher risk for receiving gadolinium administration. We evaluated the utility of non-contrast T1 mapping (native T1) for assessment of myocardial damages in hypertrophic cardiomyopathy (HCM), in comparison with LGE and extracellular volume fraction (ECV).
Methods: Twenty-two patients with HCM and 8 normal controls underwent 3T-cardiac MRI. T1 mapping using a faster Modified Look-Locker Inversion-recovery method was performed at pre-contrast and post-contrast. We measured the segment-based native T1 and ECV. The presence or absence of LGE was also decided visually for each segment.
Results: The mean native T1 and ECV of myocardium in HCM were 1292 ± 74 msec and 34.3%, respectively. Native T1 of apparently LGE-negative segments, as well as of LGE-positive segments, was significantly longer and ECV was significantly higher than the respective values for normal myocardium. Native T1 was significantly correlated with ECV obtained by T1 mapping (r = 0.65, P < 0.0001). The cut-off value for native T1 to differentiate between LGE-positive and -negative segments was 1289 msec (specificity 78%, sensitivity 81%, area under the curve 0.88).
Conclusions: Native myocardial T1 mapping has the potential to quantify the volume of interstitial space without the need for gadolinium, which would be useful particularly in patients with a high risk for gadolinium administration. Furthermore, native T1 would be practical biomarker for the detection of diffuse interstitial fibrosis, which is difficult to evaluate using LGE alone.
Introduction
Hypertrophic Cardiomyopathy (HCM) is the most common inherited cardiovascular disease. Left ventricular myocardial fibrosis, a hallmark of HCM, has been implicated in promoting Heart Failure (HF) as well as risk of sudden arrhythmic death [1,2].
Late Gadolinium Enhancement (LGE) by Cardiac Magnetic Resonance (CMR) has emerged as the gold standard for imaging of myocardial damages, such as fibrosis invivo [3,4]. In patients with HCM, LGE can detect the specific pattern of fibrosis and scarring, and provide valuable diagnostic and pathophysiological insights [5,6]. Our previous study showed that the extent of LGE was a good independent predictor of adverse cardiac events and reflected mortality and morbidity more precisely than ejection fraction in HCM with systolic dysfunction [7].
Recently, myocardial T1 mapping has allowed direct myocardial signal quantification in non-contrast and post-contrast conditions and has shown potential for better characterization of myocardial tissue composition. Furthermore, myocardial T1 mapping has been applied to quantify the Extracellular Volume fraction (ECV) using non- and post-contrast T1 in myocardium and blood [8].
Both LGE and ECV require gadolinium contrast; however, in clinical use, patients with renal insufficiency, an allergic reaction to contrast agents, asthma, or other such issues are at higher risk of complications during gadolinium administration. Herein, we evaluated the utility of non-contrast T1 mapping (native T1 mapping) using a faster Modified Look-Locker Inversion-recovery (Fast-MOLLI) method for assessment of myocardial fibrosis in patients with HCM in comparison with LGE and ECV.
Materials and Methods
Participants: Twenty-two patients with HCM (12 female, 10 male; Mean age of 62.1-years-old) underwent gadolinium-enhanced Cardiac Magnetic Resonance imaging (CMR). The diagnosis of HCM was made on the basis of clinical data, echocardiography and cardiac catheterization including coronary angiography. HCM was defined as the presence of left ventricular asymmetric hypertrophy not originating from other causes, such as hypertension, aortic valve stenosis, amyloidosis and so on.
The normal controls consists of 8 patients without organic cardiac disease (3 female, 5 male; Mean age of 50.5-years-old). Although all of the patients had mild arrhythmia or abnormal ECG findings, clinical examinations including echocardiography, laboratory data, coronary angiography and CMR ruled out the myocardial disease.
CMR protocol: CMR examinations were performed on a 3-T clinical scanner (MAGNETOM Verio, Siemens AG Healthcare Sector, Erlangen, Germany). All CMR images were electrocardiographically gated and obtained during repeated breath-holds.
Cine images were acquired with a steady-sate free precession sequence (true-FISP) with the following parameters: echo time [TE] 1.53 msec, repetition time [TR] 3.43 msec, flip angle 50 degrees, slice thickness 5 mm, gaps 5 mm, in-plane resolution 1.7 mm × 1.3 mm. LGE using a segmented Inversion-Recovery (IR) prepared true-FISP sequence at 10 min after the administration of 0.125 mmol/kg body weight of gadolinium diethylenetriamine penta-acetic acid (Gd-DTPA). LGE data was obtained during the mid-diastolic phase with an inversion time 350 msec (TE 1.13 msec, TR 2.75 msec, slice thickness 8 mm, gaps 2 mm, in plane resolution 1.9 mm × 1.5 mm).
T1 measurements were obtained from a fast-Modified Look- Locker Inversion-recovery (fast-MOLLI) sequence at short-axial slice in basal, and mid-ventricular level at pre-contrast and post-contrast 21 minutes after gadolinium administration. Fast-MOLLI was implemented as 2 Inversion Recovery (IR) sequence with the first of 3 and the second of 5 consecutive image acquisitions (Figure 1).
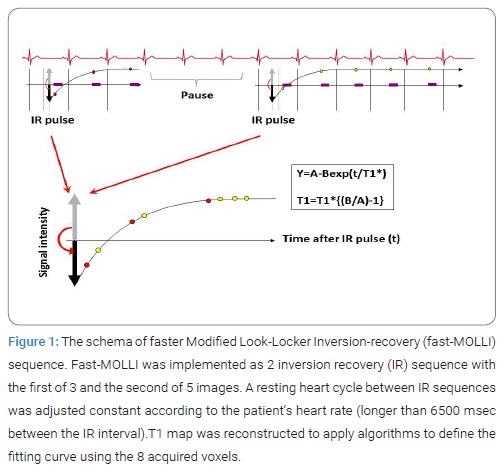
A resting heart cycle between IR sequences was adjusted constant according to the patient‘s heart rate (longer than 6500 msec between the IR interval) as a method of stabilizing the error of T1 measurement. T1 map was reconstructed using 8 source images with different inversion time. Imaging parameters were as follows: TE 1.1 msec, TR 2.5 msec, flip angle 35 degrees, slice thickness 8 mm in plane resolution 3.1 mm x 1.7 mm. The true-FISP readout in fast-MOLLI used short RF pulses and high bandwidth to minimize banding artifact. All images were performed during suspended respiration.
Image assessment: After T1 mapping before contrast was generated, the LV myocardium was divided into 6 segments in each slice, and fan-shaped regions of interest (ROIs) were set in each segment. Then, a segment-based native T1 was measured for each ROI using the dedicated software (Qmass®, Medis, Leiden, Netherlands).
For Evaluation of Extracellular Volume fraction (ECV), we quantified as following formula:
ECV = λ*(1 - hematocrit)
λ = ⊿R1myocardium / ⊿R1bloodpool
R1 = 1 / T1
Regarding nomenclature, note that ECV term is synonymous with the myocardial contrast volume of distribution and the myocardial fibrosis index and is a linear transformation of the extravascular extracellular volume fraction. Each ECV measurement for a short axis slice location was derived from a native T1 acquisition and a post-contrast acquisition occurring 21 minutes after the contrast bolus by using automatically analyzing software (Mapmaker®, Medis, Leiden, Netherlands.). The ECV map was also divided into 6 segments in each slice and segment-based ECV values were measured. Hematocrit measures were acquired on the day of scanning. The presence or absence of LGE was decided visually for each segment. Cine images were analyzed using ARGUS software (Siemens AG Healthcare Sector, Erlangen, Germany) to calculate LV volumes, mass and function.
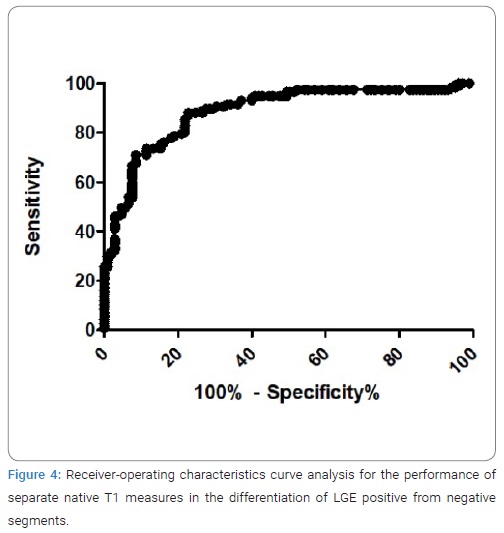
Statistical analysis: All values were expressed as mean ± 2SD. Continuous variables were compared using the Student t test. Correlation of native T1 values and T1 mapping-derived ECV in all segments with HCM and normal controls was assessed by Spearman’s correlation analysis. The sensitivity, specificity, diagnostic accuracy, areas under the curve and cutoff values for the performance of separate native T1 measures in the differentiation of LGE positive from negative segments were derived using receiver-operating characteristic curve analysis using the point that maximized the trade-off between specificity and sensitivity. All statistical tests were performed with commercial spreadsheet software (GraphPad Prism Version 5). A value of p < 0.05 was considered statistically significant.
Results
(Table 1) Summarized the clinical characteristics of the HCM and normal controls.
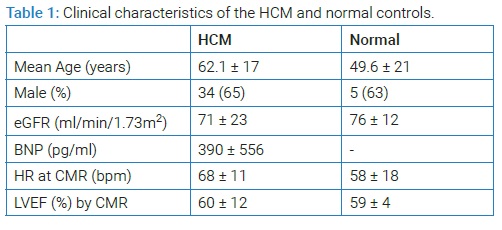
There were no differences in sex, heart rate at CMR study, renal function and left ventricular ejection fraction between the two groups, although the HCM patients were older than the normal controls. In 4 of total 264 segments of HCM patients and 2 of 75 segments of normal controls, banding artifact near epicardium occurred at T1 map and these segments were excluded for analysis. There were 117 LGE positive segments (45%), as patchy enhancement or intramyocardial stria, and 143 LGE negative segments (55%) in HCM patients. Whereas, no LGE positive segment was seen in normal controls. (Figure 2) shows mean native T1 and ECV of normal, all HCM segments, LGE-positive and LGE-negative HCM segments. The mean native T1 was significantly longer in HCM (1292 ± 74 msec) compared with normal controls (1146 ± 43 msec) (p < 0.0001). The mean ECV was significantly higher in HCM (34.3%) compared with normal controls (26.0%) (p < 0.0001). In HCM, mean native T1 was significantly longer in segments with LGE (1339 msec) than the respective values for in segments without LGE (1227 msec) (p < 0.0001) and normal myocardium (1146 msec) (p < 0.0001).
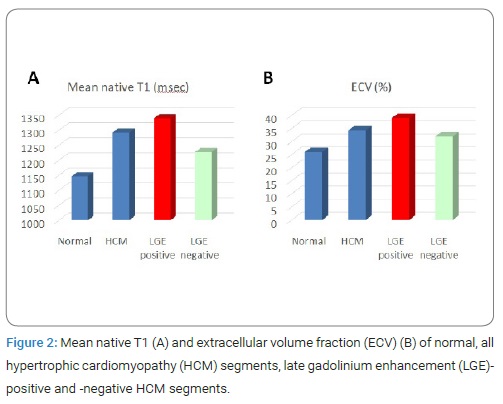
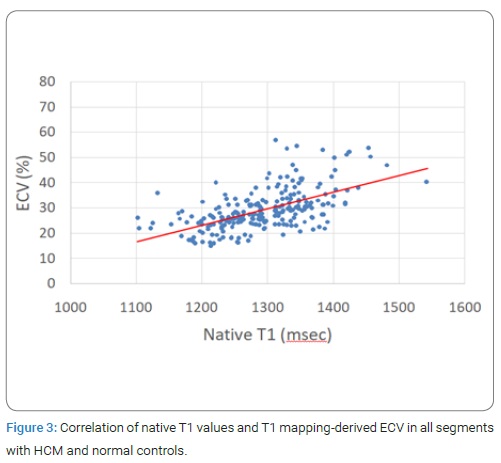
However, even in segments not demonstrating LGE, mean native T1 was significantly longer than thosefor normal myocardium (p < 0.0001). Also, ECV of apparently LGE-negative segments (32.0%), as well as of LGE-positive segments (39.0%) were significantly higher than those for normal myocardium (26.0%). (Figure 3) showed the correlation of native T1 values and T1 mapping-derived ECV in all segments with HCM and normal controls. Native T1 was significantly correlated with ECV obtained by T1 mapping (r = 0.65, P < 0.0001).
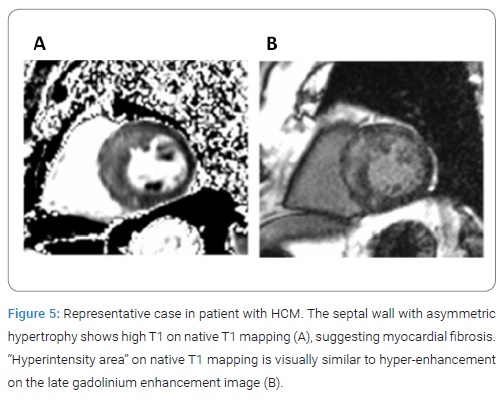
Result of receiver-operating characteristics curve analysis for the performance of separate native T1 measures in the differentiation of LGE positive from negative segments was presented in (Figure 4). The cut-off value for native T1 to differentiate between LGE-positive and -negative segments was 1289 msec, with specificity of 78%, sensitivity of 81% and area under the curve of 0.88. (Figure 5) shows representative case in patient with HCM. “Hyperintensity area” on native T1 map was visually similar to hyper-enhancement on the LGE image.
Discussion
The results in this study demonstrate that native T1 in HCM is well correlated with ECV quantified by measurement of non-contrast and post-contrast T1 in myocardium and blood. ECV is in proportion to tissue concentration of gadolinium and is effective for the quantification of tissue enhancement. Recent studies showed that ECV measurement derived by CMR reflect myocardial collagen volume fraction quantified histologically from whole heart undergoing transplantation [9] and endomyocardial biopsy in DCM [10]. Therefore, CMR-based assessment of ECV have a potential to serve as a non-invasive tool for the quantification of myocardial fibrosis in order to monitor therapy and aid risk stratification in cardiomyopathy. However, ECV need gadolinium contrast, which is higher risk to patients with renal insufficiency, contrast agent allergy, asthma and so on. In addition, although the reconstruction of ECV map needs the accurate registration between pre- and post-contrast T1 map, a misregistration sometimes occurs, which cause the measurement error. Therefore, a novel non-invasive and more ease-to-use method for the detection of myocardial fibrosis in a broader spectrum of patients is needed.
In this study, we showed native T1 mapping could detect the degree of myocardial extracellular space enlargement in HCM without the administration of contrast media and have potential to become an alternative to ECV and LGE. Furthermore, in subjects with low pre-test likelihood for the presence of cardiomyopathy, or those in whom contrast administration is contraindicated, it may serve as an effective screening test.
In our study, native T1 mapping is visually similar to LGE images, and native T1 value provide the sufficient distinction between LGE positive and negative segments with high diagnostic accuracy, sensitivity and specificity. Native T1 increases with pathologies where increased water in myocardial extracellular space is present such as focal or diffuse fibrosis [11].
LGE is the widely used method to evaluate the myocardial fibrosis in various heart diseases. In the conventional LGE using the null-point method, image contrast relies on the difference in signal intensity between fibrotic and “normal” myocardium. However, such difference may not be detected if the fibrosis is diffuse or subtle. Therefore, the conventional LGE has a limitation in accurate diagnosis of such fibrotic change. The results in this study demonstrated that the apparently unenhanced myocardium in LGE images showed a longer native T1 than normal myocardium, suggesting that native T1 could provide a better characterization of myocardial tissue composition, such as early myocardial involvement and interstitial diffuse fibrosis, which is difficult to evaluate by LGE alone. Further studies are needed to put native T1 mapping to practical use, such as monitoring of therapeutic effect and prognostic information.
A recent study showed that non-contrast T1 values correlated significantly with phosphocreatine-to-ATP ratio in magnetic resonance spectroscopy, indicating that native T1 mapping could be affected by additional changes such as the cardiomyocyte energetic state [12]. As extracellular fibrosis leads to myocardial stiffening [13], periarteriolar fibrosis [14], and diastolic dysfunction [15], its presence may well affect the cardiomyocyte energetic state. Thus, it is possible that the more subtle changes detected by T1 values are a reflection of the extracellular matrix effects on the cardiomyocyte energetic state. It is also tempting to speculate that, as a second potential mechanism, energetically impaired myocardium in HCM is more vulnerable to membrane instability and ion pump dysfunction, resulting in intracellular fluid changes contributing to the T1 signal.
In this study, we used the Fast MOLLI method for myocardial T1 quantification. MOLLI sequence described by Messroghli et al. provides high resolution T1 map of myocardium in native and post-contrast situation within a 17 heart-beat breath hold [16]. However, long breath holds often limit clinical application in patients due to motion artifact and heart rate variability. Fast-MOLLI method was implemented as a two Inversion Recovery (IR) sequence with the first of three and the second of five consecutive image acquisitions, decreasing the acquisition time and reliable for T1 estimation with results very close to Original MOLLI (Morita Y et al., presented at the 2012 annual meeting of International Society for Magnetic Resonance in Medicine). Previous studies showed that reduced breath-hold MOLLI T1 mapping protocol by using methods similar to our study results same as the conventional MOLLI technique [17,18].
MOLLI sequences are known to systematically underestimate true T1 values, since the later images are influenced by the previous inversions, in particular with regard to the tissue of the longer T1 relaxation times. Relying on R-R intervals for the timings results in T1 estimations being easily affected by incomplete tissuerecovery between inversions, especially at higher heart rates [19]. In this study, we corrected a resting heart cycle between IR sequences constant depending on the patient‘s heart rate as a method of stabilizing the error of T1 measurement.
Our study has certain limitations. First, the number of patients was relatively small. The small sample size of otherwise similar groups may limit the associations with sex and age. Larger multicenter study is required to reconfirm our findings. Second, in this study, native T1 mapping using Fast-MOLLI was performed in two slices of basal and mid-ventricular levels. MOLLI technique offers only single slice T1 mapping in one breath-hold and it is time consuming to obtain multiple slices. Future advances in sequence development that provide whole heart coverage derive more useful approach in clinical use. Third, no histopathologic validation was obtained for evaluation of the myocardial damages such as fibrosis. Native T1 increases with various types of pathologies where increased water is present such as edema, focal or diffuse fibrosis and amyloidosis. Further study regarding the pathological correlation with native T1 values is needed.
Conclusion
Native myocardial T1 mapping using Fast-MOLLI has the potential to quantify the volume of interstitial space without the need for gadolinium, which would be useful particularly in patients with a high risk for gadolinium administration. Furthermore, native T1 would be a useful and practical biomarker for the detection of myocardial damages, which is difficult to evaluate using conventional LGE images alone.
Conflict of Interest
The authors declare no potential conflicts of interest with respect to the research, authorship, and/or publication of this article. Informed consent was obtained for this publication.
References
- Kwon DH, Smedira NG, Rodriguez ER, Tan C, Setser R, Thamilarasan M, et al. Cardiac magnetic resonance detection of myocardial scarring in hypertrophic cardiomyopathy: correlation with histopathology and prevalence of ventricular tachycardia. J Am Coll Cardiol. 2009;54:242–249.
- Carolyn Y Ho, Begoña López, Otavio R Coelho-Filho, Neal K Lakdawala, Allison L Cirino, et al. Myocardial fibrosis as an early manifestation of hypertrophic cardiomyopathy. N Engl J Med. 2010;363:552–563.
- Kwong RY, Farzaneh-Far A. Measuring myocardial scarby CMR. JACC Cardiovasc Imaging. 2011;4:157–160.
- Moon JC, Reed E, Sheppard MN, Elkington AG, Ho SY, Burke M, et al. The histologic basis of late gadolinium enhancement cardiovascular magnetic resonance in hypertrophic cardiomyopathy. J Am Coll Cardiol. 2004;43:2260–2264.
- Rickers C, Wilke NM, Jerosch-Herold M, Casey SA, Panse P, Panse N, et al. Utility of cardiac magnetic resonance imaging in the diagnosis of hypertrophic cardiomyopathy. Circulation. 2005;112:855–861.
- Rudolph A, Abdel-Aty H, Bohl S, Boyé P, Zagrosek A, Dietz R, et al. Noninvasive detection of fibrosis applying contrast-enhanced cardiac magnetic resonance in different forms of left ventricular hypertrophy relation to remodeling. J Am Coll Cardiol. 2009;53:284–291.
- Funada A, Kanzaki H, Noguchi T, Morita Y, Sugano Y, Ohara T. et al. Prognostic significance of late gadolinium enhancement quantification in cardiac magnetic resonance imaging of hypertrophic cardiomyopathy with systolic dysfunction. Heart Vessels. 2016;31(5):758–770.
- Ugander M, Oki AJ, Hsu LY, Kellman P, Greiser A, Aletras AH, et al. Extracellular volume imaging by magnetic resonance imaging provides insights into overt and sub-clinical myocardial pathology. Eur Heart J. 2012;33(10):1268–1278.
- Miller CA, Naish JH, Bishop P, Coutts G, Clark D, Zhao S, et al. Comprehensive validation of cardiovascular magnetic resonance techniques for the assessment of myocardial extracellular volume. Circ Cardiovasc Imaging. 2013;6(3):373–383.
- aus dem Siepen F, Buss SJ, Messroghli D, Andre F, Lossnitzer D, Seitz S, et al. T1 mapping in dilated cardiomyopathy with cardiac magnetic resonance: quantification of diffuse myocardial fibrosis and comparison with endomyocardial biopsy. Eur Heart J Cardiovasc Imaging. 2015;16(2):210–216.
- Bull S, White SK, Piechnik SK. Human non-contrast T1 values and correlation with histology in diffuse fibrosis. Heart. 2013;99(13):932-937.
- Dass S, Suttie JJ, Piechnik SK, Flett AS, Ferreira VM, Loudon M, et al. Myocardial tissue characterization using magnetic resonance noncontrast T1 mapping in hypertrophic and dilated cardiomyopathy. Circ Cardiovasc Imaging. 2012;5(6):726–733.
- Weber KT, Brilla CG. Pathological hypertrophy and cardiac interstitium. Fibrosis and Renin-Angiotensin-Aldosterone System. Circulation. 1991;83:1849–1865.
- Schwartzkopff B, Brehm M, Mundhenke M, Strauer BE. Repair of coronary arterioles after treatment with perindopril in hypertensive heart disease. Hypertension. 2000;36:220–225.
- Brilla CG, Funck RC, Rupp H. Lisinopril-mediated regression of myocardial fibrosis in patients with hypertensive heart disease. Circulation. 2000;102:1388–1393.
- Messroghli DR, Radjenovic A, Kozerke S, Higgins DM, Sivananthan MU, Ridgway JP. Modified Look-Locker inversion recovery (MOLLI) for high-resolution T1 mapping of the heart. Magn Reson Med. 2004;52(1):141–146.
- Lee JJ, Liu S, Nacif MS, Ugander M, Han J, Kawel N, et al. Myocardial T1 and extracellular volume fraction mapping at 3 tesla. J Cardiovasc Magn Reson. 2011;13:75.
- Salerno M, Janardhanan R, Jiji RS, Brooks J, Adenaw N, Mehta B, et al. Comparison of methods for determining the partition coefficient of gadolinium in the myocardium using T1 mapping. J Magn Reson Imaging. 2013;38(1):217–224.
- Messroghli D, Greiser A, Frohlich M, Dietz R, Schulz-Menger J. Optimizationand validation of a fully-integrated pulse sequence for modified Look–Locker inversion-recovery (MOLLI) T1 mapping of the heart. J Magn Reson Imaging. 2007;26:1081–1086.
Keywords
Hypertrophic cardiomyopathy; Late gadolinium enhancement; Inversion recovery; Cardiac magnetic resonance
Cite this article
Morita Y, Yamada N, Noguchi T, Fukuda T. Detection of myocardial damages in hypertrophic cardiomyopathy using non-contrast T1 mapping. Clin Surg J. 2021;2(4):1–6.
Copyright
© 2021 Yoshiaki Morita. This is an open access article distributed under the terms of the Creative Commons Attribution 4.0 International License (CC BY-4.0).